
2.1
What Is a Stock Quote?
A stock quote is a real-time or delayed snapshot of a stock’s current trading data. It shows the last traded price, the current bid and ask prices, trading volume, and a range of other statistics. Every broker platform, financial website, and trading terminal displays quotes — the fields are largely standardized across all of them.
Quotes come in two versions: real-time and delayed. Real-time quotes update continuously during market hours. Delayed quotes — typically 15 minutes behind — are the default on free financial websites. As a trader, you need real-time quotes. Most brokers provide them free with an account. Never make a trade decision based on a delayed quote.
|
2.2
The Ticker Symbol: What It Is and How to Find One
Every publicly listed company has a unique ticker symbol—a short alphanumeric code used to identify it on an exchange. Tickers are the universal language of trading. Use them instead of company names to avoid confusion and execution errors.
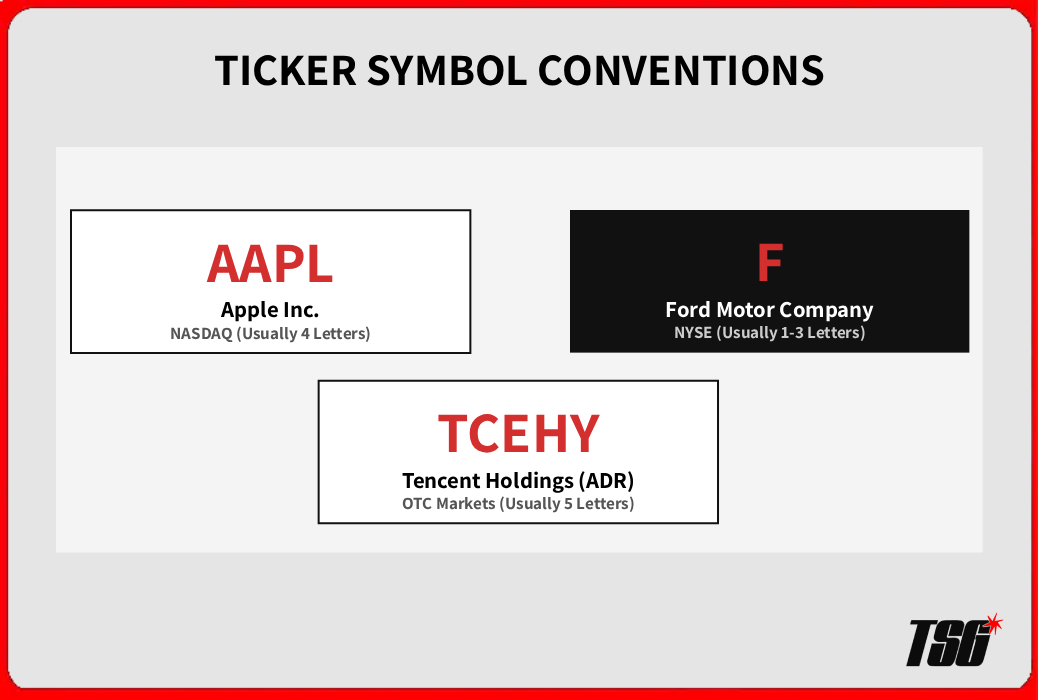
Figure 1 — Common Ticker Symbols: exchange, company type, and naming conventions at a glance
To find a ticker, search the company name on any financial platform—Google Finance, Yahoo Finance, or your broker’s search bar. Always confirm the exchange alongside the ticker to avoid confusion between companies with identical names listed in different countries.
2.3
Last Price vs. Bid vs. Ask — What Is the Difference?
These three numbers are the most important in any quote, and beginners constantly confuse them. Understanding the difference determines whether your order fills at the price you expect.
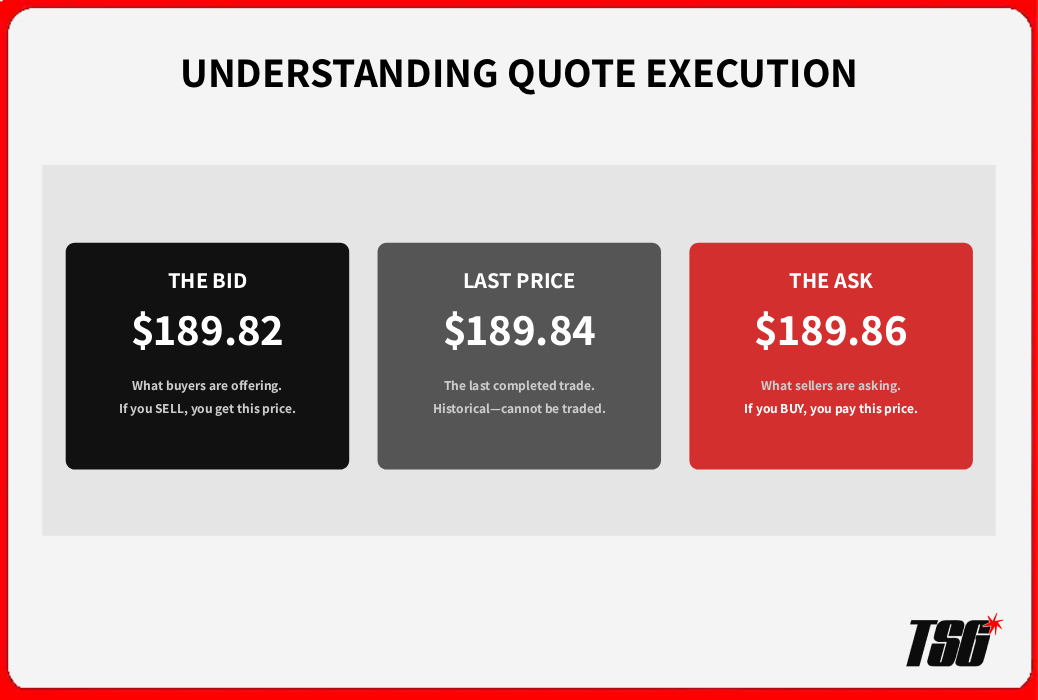
Figure 2 — Last price, bid, and ask: three different numbers with three very different meanings for trade execution
Example: AAPL shows Last: $189.84, Bid: $189.82, Ask: $189.86. If you place a market buy order right now, you pay $189.86—not $189.84. The last price is already gone; the ask is the real cost of entry.
The Bid-Ask Spread: Why It Matters to Traders
The spread is the gap between the bid and the ask—and it is an invisible cost on every trade. On a liquid stock like Apple, the spread might be just $0.01–$0.04. On a low-volume small-cap stock, it could be $0.30 or more. Every time you enter and exit a position, you pay the spread twice—once on entry, once on exit.
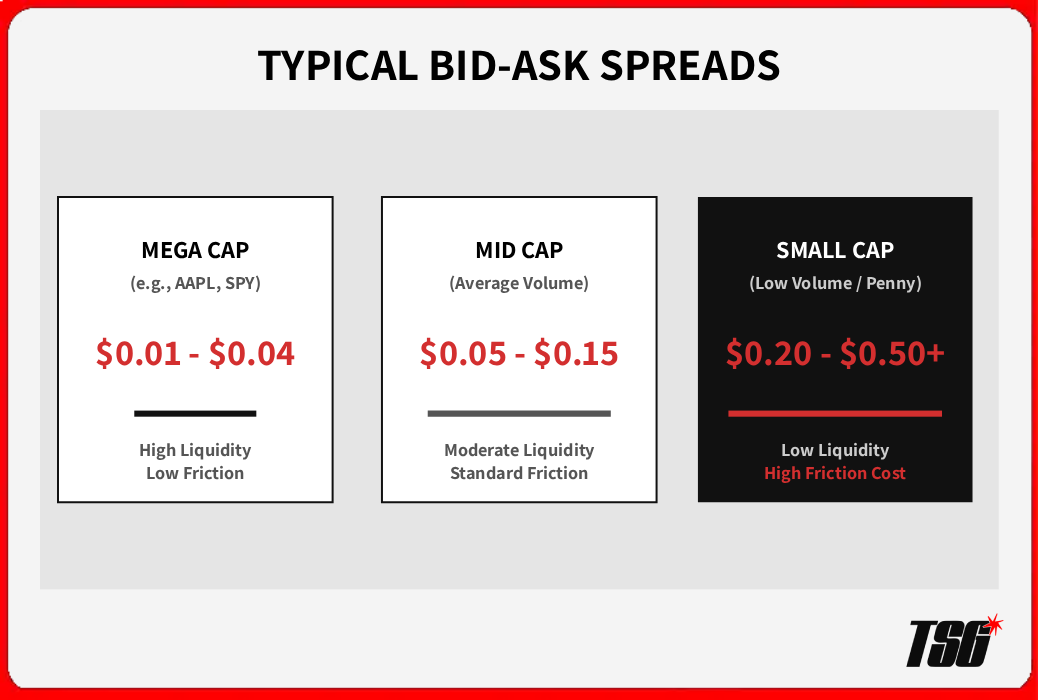
Figure 3 — Bid-ask spread by stock type: the wider the spread, the more ground a trade must cover to be profitable.
This is why liquidity matters. A stock with a $0.30 spread needs to move $0.60 in your favor just to break even on a round trip. On a $0.02 spread stock, you only need a $0.04 move. Wider spreads mean you need larger price moves to profit, which reduces the number of viable setups.
|
2.4
Volume: How Many Shares Are Trading Today?
Volume is the total number of shares traded in a given period. It is one of the most powerful confirmation tools in active trading. Price moves without volume are weak; price moves backed by high volume carry conviction.
Every stock quote shows two volume figures: today’s volume and average daily volume. Together, they tell you whether today’s activity is normal or extraordinary—and extraordinary activity is where the most significant price moves occur.
Average Daily Volume vs. Today’s Volume
Average daily volume (ADV) is calculated over the prior 30 or 90 days, depending on the platform. It gives you a baseline. If a stock normally trades 2 million shares per day and today’s volume is already 8 million by midday, something significant is happening—an earnings report, a news catalyst, or institutional accumulation.
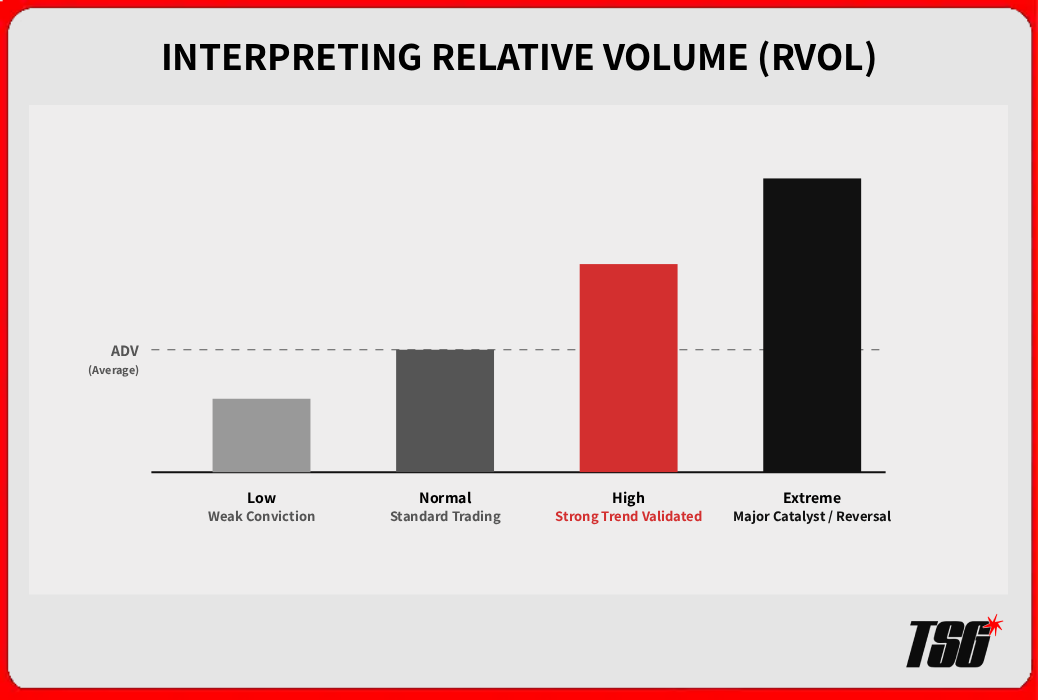
Figure 4 — Volume signal levels: compare today’s volume to the ADV baseline to gauge conviction and identify catalysts
Why High Volume Matters for Trade Confirmation
In technical analysis, a breakout above resistance on high volume is far more reliable than a breakout on low volume. High volume means many participants agreed the price deserved to move—that consensus creates momentum. A breakout on low volume can reverse the moment a single large seller steps in.
Volume also confirms the trend in health. In a healthy uptrend, volume expands on up days and contracts on down days. When that pattern reverses—volume growing on red days—it signals the trend may be weakening.
2.5
The Daily Range: High, Low, and Open
The daily range tells you how much a stock has moved today and where the session started. Three figures form the picture:
- Open: The first traded price of the day. Set by the opening auction process at 9:30 AM ET.
- Day High: The highest price reached during the current session.
- Day Low: The lowest price reached during the current session.
The daily range is a direct measure of volatility. A stock with a $0.50 daily range on a $50 stock (1%) is calm and controlled. A stock with a $5 daily range on that same $50 stock (10%) is highly volatile. Volatile stocks offer greater profit and loss potential—your position size must reflect the range.
The relationship between today’s open and the current price also matters. A stock that opened at $100 and is now trading at $105 has strong bullish momentum. A stock that opened at $100 and is now at $97—with volume rising—is showing distribution. These are trade signals, not just statistics.
|
2.6
The 52-Week High and Low
The 52-week range shows the highest and lowest prices a stock has traded at over the past year. These two numbers are among the most-watched levels in all of trading. When a stock approaches its 52-week high or low, the price behavior becomes highly predictable and tradeable.
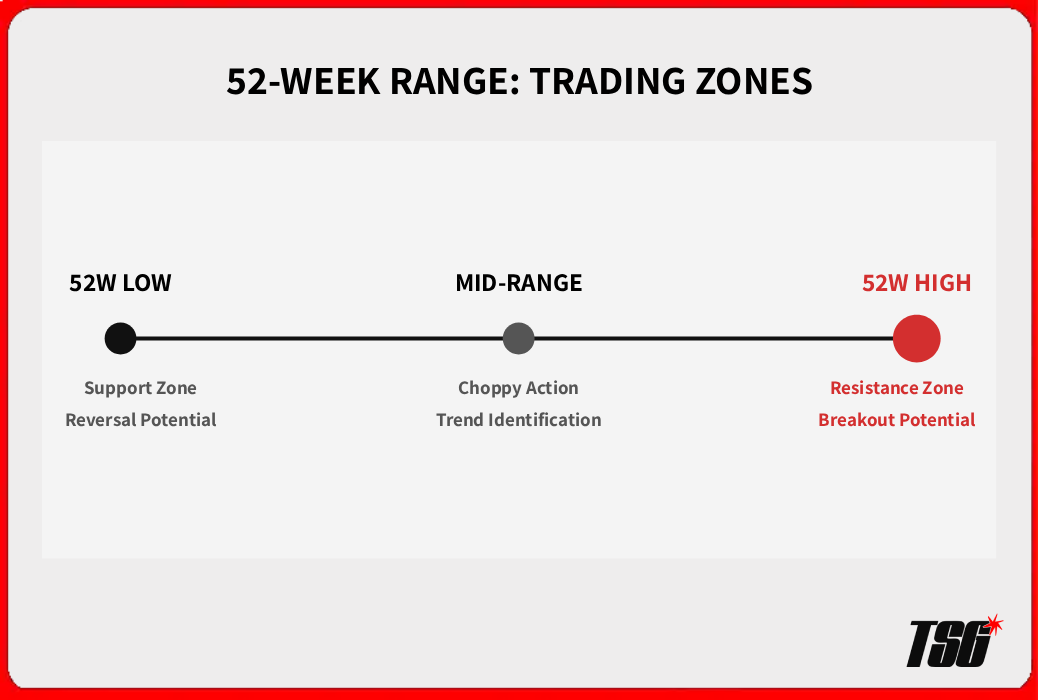
Figure 5 — 52-week range: the three price zones traders watch and what each signals for trade decisions.
2.7
Stock Quote and the Market Capitalization
Market capitalization (market cap) is the total market value of a company’s outstanding shares. The formula is simple: current share price multiplied by total shares outstanding.
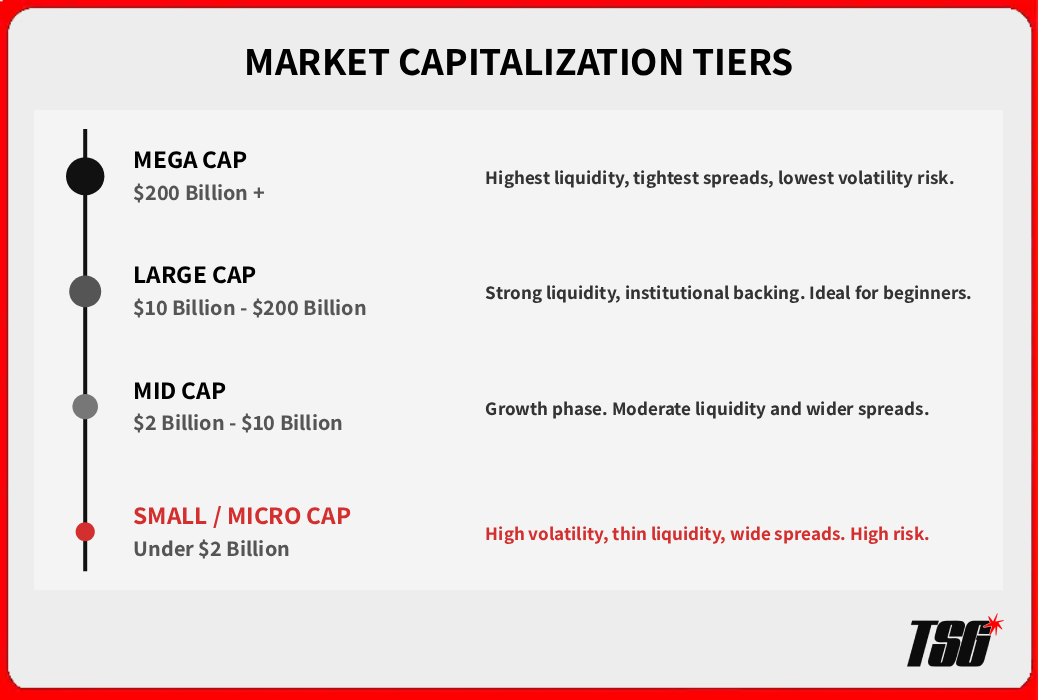
Figure 6 — Market cap tiers: a quick proxy for liquidity, spread width, and volatility risk before you place a trade.
For beginners, market cap is a quick proxy for risk level. Stick to large and mega-cap stocks while learning. The wider spreads and lower liquidity of small-caps amplify both gains and losses—and execution errors.
2.8
P/E Ratio on a Stock Quote — Should Beginners Care?
The P/E ratio (price-to-earnings) compares a stock’s price to its annual earnings per share. A P/E of 20 means you are paying $20 for every $1 of annual earnings.
For active traders who use technical analysis as their primary tool, the P/E ratio is less immediately relevant than it is for investors. You are not holding a position for years—you are targeting a specific price move over days or weeks. The short-term catalyst matters more than long-term valuation.
That said, the P/E ratio still provides useful context. A stock trading at 80x earnings has significant downside risk if sentiment shifts, because the valuation leaves no margin of safety. A stock at 12x earnings has a natural floor of fundamental buyers. Knowing the P/E prevents you from trading a high-valuation stock as if it were a stable blue chip.
|
2.9
Dividend Yield and Ex-Dividend Date
Dividend yield shows the annual dividend payment as a percentage of the current share price. For short-term traders, this is mostly background noise—except on one specific date.
The ex-dividend date is critical for traders to know. If you hold a stock on its ex-dividend date, you receive the dividend. If you buy it after that date, you do not.
On the ex-dividend date itself, the stock’s price typically falls by approximately the dividend amount at the open. If you hold an open position going into an ex-dividend date, expect a price gap down at the open. This is not a technical breakdown—it is a mechanical adjustment. Factor it into your stop-loss placement to avoid a premature exit from a valid trade.
2.10
Putting It All Together: Reading a Real Stock Quote
Below is a sample quote for Apple Inc. (AAPL). Walk through each field using the framework from this article. The goal is to scan a quote in under 30 seconds and extract a clear picture of the stock’s current state.
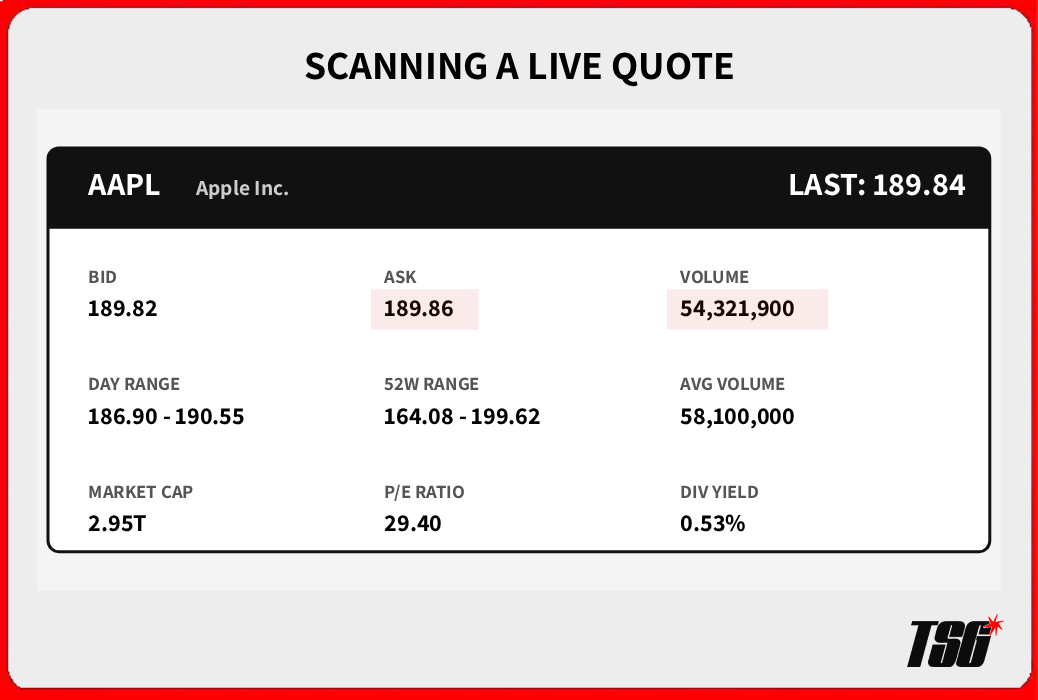
Figure 7 — AAPL live quote: scanning all data fields as a trader in under 30 seconds.
Reading this stock quote as a trader:
- Spread ($0.04): Tight and acceptable. Entry/exit costs are minimal.
- Volume (54M vs 58M avg): Normal session—no unusual catalyst today.
- Day range ($186.90–$190.55): A $3.65 range. Current price is near the top of the day’s range—buying here means chasing.
- 52W range ($164.08–$199.62): Price is in the upper third of the annual range. No breakout setup yet—the 52W high is still $9.78 away.
- Float (15.28B): Massive float. Price moves slowly and requires enormous volume to generate sharp moves.
- P/E (29.4): Moderate for a mega-cap tech company. Not stretched, not cheap.
|
2.11
Frequently Asked Questions
Where can I find real-time stock quotes for free?
Most retail brokers provide free real-time quotes when you open an account. TradingView offers real-time data for US stocks on its free tier. Yahoo Finance and Google Finance show quotes with a 15-minute delay unless you connect a brokerage account.
What does ‘float’ mean on a stock quote?
Float is the number of shares available for public trading — the total shares outstanding minus insider holdings and restricted shares. A low float stock (under 20 million shares) can move violently on relatively small volume because there are fewer shares to absorb buying or selling pressure. High-float stocks move more slowly and predictably.
Why does the last price sometimes differ from the bid and ask?
The last price is historical — it reflects the most recent completed trade. The bid and ask are live — they update in real time as buyers and sellers adjust their offers. In a fast-moving market, the last price can lag several cents behind the current bid/ask. Always use the ask for buying and the bid for selling when estimating your actual fill price.
What is a good bid-ask spread for a beginner to trade?
As a general rule, look for spreads no wider than 0.1% of the stock price. On a $100 stock, that is $0.10. For liquid large-cap stocks and major ETFs, spreads are typically $0.01–$0.05 — well within that threshold. Avoid trading stocks with spreads above $0.20–$0.30 until you have sufficient experience to factor that cost into every setup.
2.12
Quiz
Continue Your Learning
➜ Ready to see these numbers across two different exchanges? Read next: NYSE vs NASDAQ — What’s the Difference for Traders?

