
3.1
A Quick Overview: Two Giants of US Equity Markets
When comparing the NYSE vs NASDAQ, it is clear these two giants dominate global equity markets. Moreover, they process the vast majority of daily US trading volume. Every major stock you trade lists on one of them.
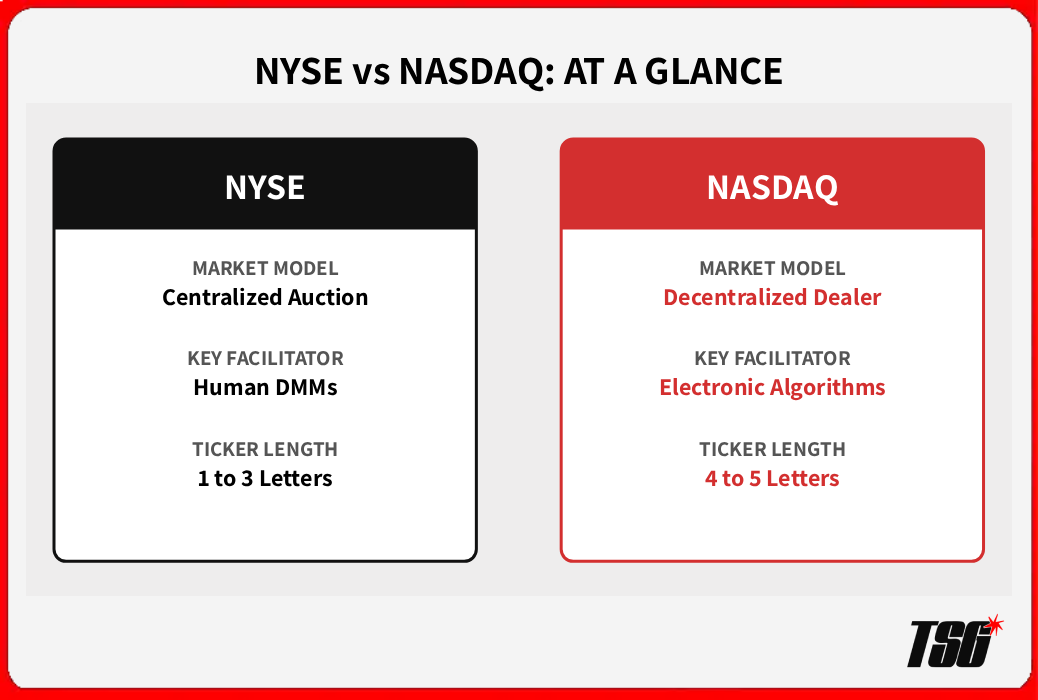
Figure 1 — NYSE vs NASDAQ: key structural and statistical differences at a glance
Fundamentally, the key difference is structural. Specifically, the NYSE uses a hybrid auction model with human market participants on the floor, while NASDAQ operates as a fully electronic dealer network. Both lists thousands of companies. Furthermore, each exchange is regulated by the SEC. Ultimately, they both give retail traders identical access through a standard brokerage account.
|
Market Structure: NYSE vs. NASDAQ Execution Models
| Feature | NYSE | NASDAQ |
|---|---|---|
| Market Model | Centralized Auction | Decentralized Dealer Network |
| Key Facilitator | Designated Market Makers (DMMs) | Competing Broker-Dealers |
| Execution Style | Hybrid (Human + Electronic) | 100% Algorithmic / Electronic |
| Ticker Convention | Usually 1 to 3 letters | Usually 4 to 5 letters |
3.2
How Trading Works Differently: NYSE vs NASDAQ Execution Models
Indeed, the structural difference between the NYSE and NASDAQ is real—and it has practical consequences for how prices are formed, how orders are matched, and how smoothly trades execute in volatile conditions.
NYSE: The Auction Market Model
The NYSE uses a centralized auction model coordinated by Designated Market Makers (DMMs). DMMs are exchange-assigned firms responsible for maintaining fair and orderly markets in specific stocks. They have obligations: they must quote continuous bid and ask prices and step in with their own capital when there is a temporary imbalance between buyers and sellers.
This human element—a DMM physically or electronically managing order flow—creates a stabilizing effect during volatile sessions. The NYSE’s opening and closing auctions are among the most important price-setting mechanisms in global markets. Billions of dollars of institutional orders are executed at the NYSE open and close each day.
NASDAQ: The Dealer Market Model
NASDAQ operates through a network of competing market makers—broker-dealer firms that post their own bid and ask prices for each stock. There is no central auction. Multiple dealers compete simultaneously, and the best available bid and ask from all dealers form the National Best Bid and Offer (NBBO). This competition between dealers is what keeps spreads tight on high-volume NASDAQ stocks.
Because NASDAQ is fully electronic with no floor, order matching is faster and entirely algorithm-driven. This suits the technology-heavy, high-volume stocks that dominate NASDAQ’s listings—names where milliseconds of execution speed genuinely matter to institutional traders.
What This Means for Bid-Ask Spreads
For retail traders, the practical spread difference between NYSE and NASDAQ stocks is minimal on large-cap names. Apple on NASDAQ and JPMorgan on NYSE both trade with $0.01–$0.02 spreads during regular hours.
The structural difference matters most in two scenarios: during extreme volatility, and in smaller, less-liquid names.
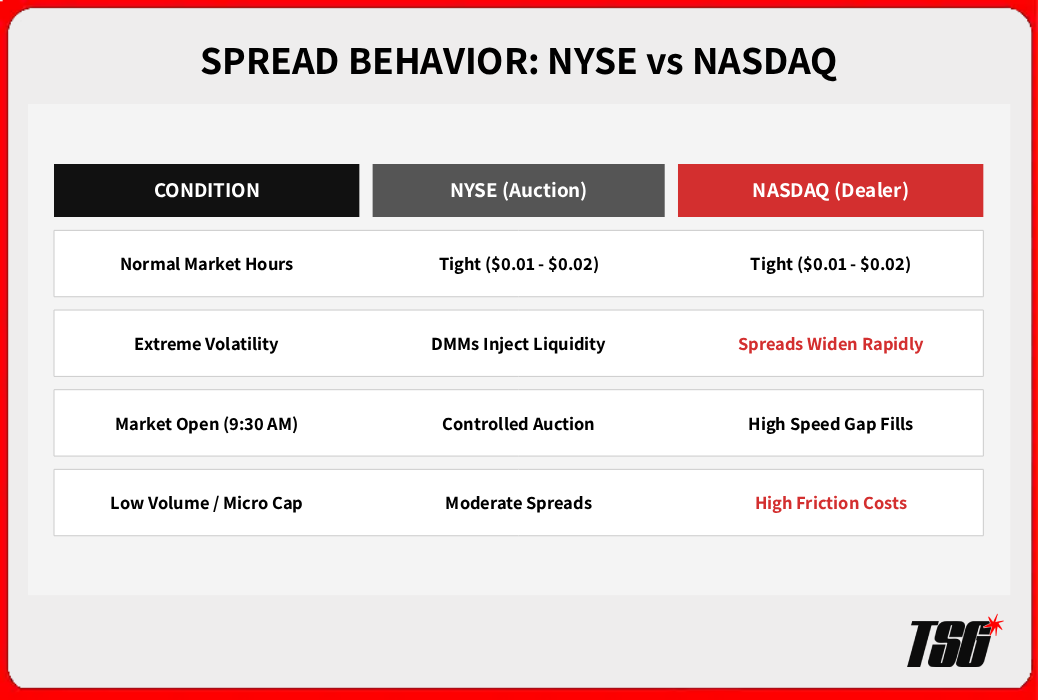
Figure 2 — How NYSE and NASDAQ spreads behave differently across four market conditions
3.3
NYSE vs NASDAQ Listing Requirements: Which Companies Qualify?
The listing standards of each exchange shape the type of companies that trade there. NYSE requirements are more stringent—reflecting its historical reputation as the home of established, blue-chip businesses. NASDAQ’s lower barriers attract younger, faster-growing companies that have not yet reached NYSE-level financial thresholds.
NYSE Listing Standards
The NYSE requires companies to meet strict financial thresholds before listing. Key requirements include:
- Minimum Market Capitalization: $200 million for most listing paths
- Pre-tax Earnings: At least $10 million in aggregate over the prior 3 years, with each year profitable
- Shareholders: Minimum of 400 shareholders holding 100 or more shares
- Public Float: At least 1.1 million publicly held shares
NASDAQ Listing Standards
NASDAQ offers three listing tiers—Global Select, Global Market, and Capital Market—with progressively lower requirements. The Capital Market tier (formerly SmallCap Market) has the lowest barriers:
- Minimum Market Capitalization: As low as $50 million on some paths
- Profitability NOT Required: Revenue or cash flow thresholds can substitute for earnings
- Public Float: Minimum 1 million publicly held shares
- Shareholder Minimum: 300 shareholders of round lots
Market Structure: NYSE vs. NASDAQ Financial Metrics
| Feature | NYSE Standard | NASDAQ (Capital Tier) |
|---|---|---|
| Minimum Market Cap | $200 Million | As low as $50 Million |
| Profitability Rules | $10M aggregate over 3 years | Revenue / Cash Flow substitute |
| Public Share Float | 1.1 Million shares | 1.0 Million shares |
|
3.4
Sector Profiles: What Each Exchange Is Known For
Sector concentration is one of the most practically useful differences between the two exchanges. Understanding which sectors dominate each exchange helps you anticipate where volatility will be higher, which stocks will react most to specific macro events, and where to look for your preferred trade setups.
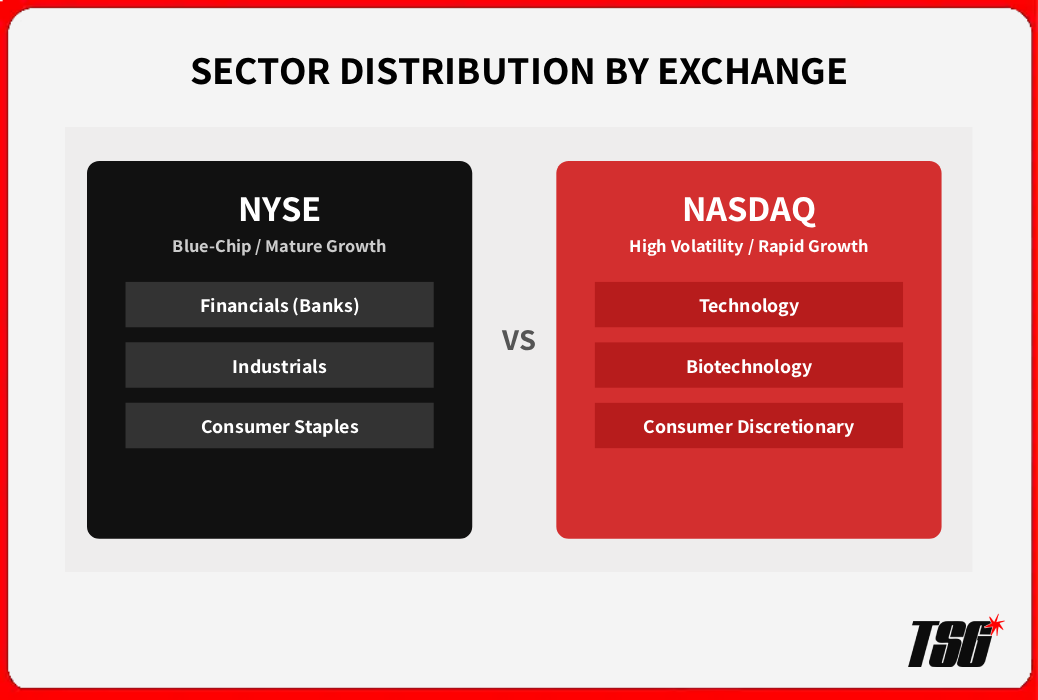
Figure 3 — Sector distribution by exchange: where each industry clusters and what it means for your trade setups
3.5
NYSE vs NASDAQ: Volatility and Liquidity Compared
At the index level, NASDAQ is more volatile than the NYSE. This is almost entirely a function of sector composition. Technology and biotechnology stocks—which dominate NASDAQ—exhibit higher average daily ranges than the financials, industrials, and consumer staples that anchor the NYSE. The exchange itself is not the cause. The stocks it lists are.
Liquidity tells a similar story. NASDAQ handles more total daily share volume than the NYSE, but this is skewed by a handful of mega-cap technology stocks that trade hundreds of millions of shares per day. At the individual stock level, NYSE blue-chips are among the most liquid instruments in the world.
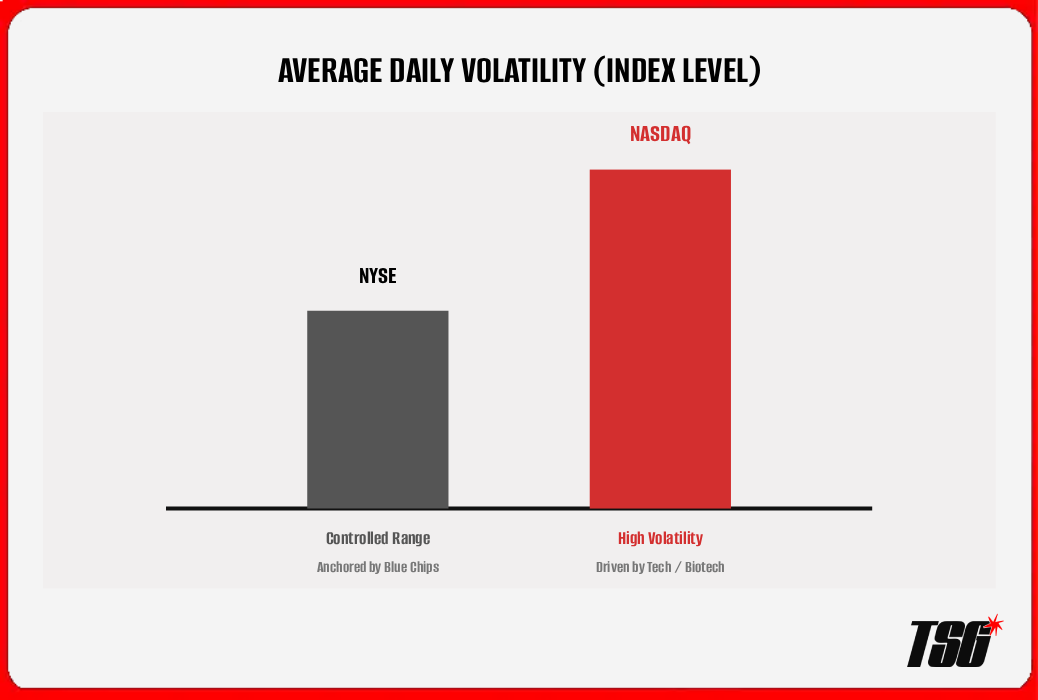
Figure 4 — Average Volatility Compared: NASDAQ leads on both metrics due to sector composition
|
3.6
Notable Stocks on Each Exchange
Knowing which major stocks are listed on which exchange is basic market literacy. It also reinforces the sector patterns above—and helps you understand why certain indices (the Dow, S&P 500, NASDAQ Composite) behave differently from each other.
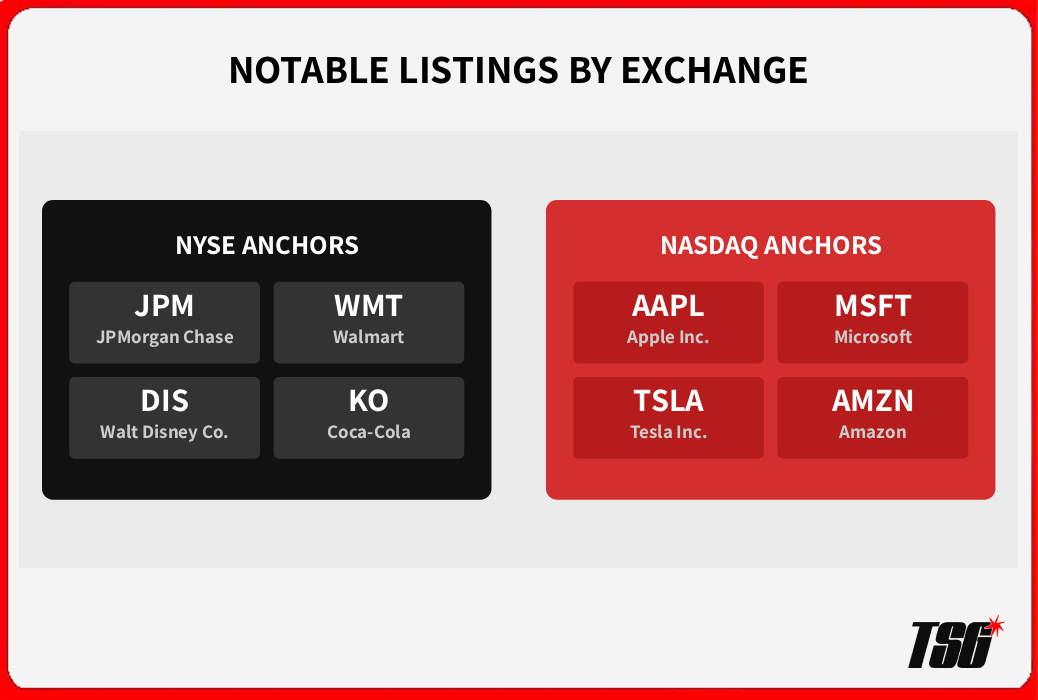
Figure 5 — Notable listings on each exchange: NYSE anchored by financials and industrials, NASDAQ by technology and growth
3.7
Does the Exchange Matter When You Place a Trade?
For most retail trades, the answer is: not directly. Your broker routes your order automatically to the best available price across all exchanges and alternative trading systems—a requirement under SEC Regulation NMS (National Market System). You do not choose which exchange executes your order. The system finds the best available bid or ask for you.
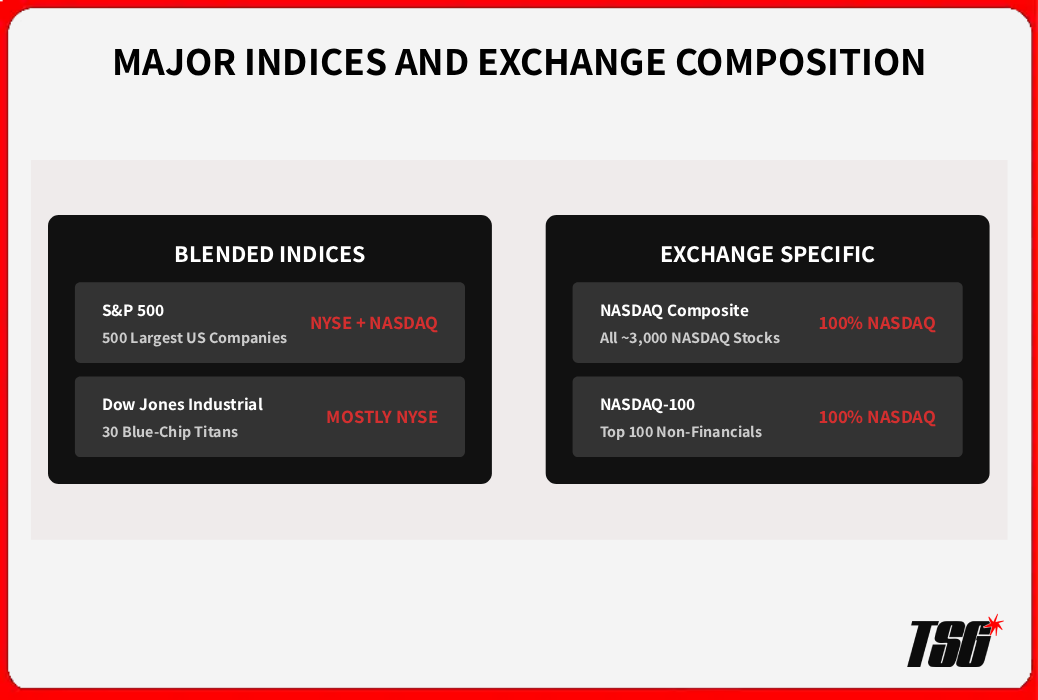
Figure 6 — The five major US indices: which exchange they draw from and what each one actually measures
What does matter is the indirect effect of exchange listing on a stock’s behavior. NASDAQ-listed technology stocks behave differently from NYSE-listed financials—not because of exchange mechanics, but because of who lists there, how institutional money flows through those sectors, and how sensitive those stocks are to different macro events.
Market Structure: Major Index Composition & Sector Focus
| Major Index | Exchange Composition | Primary Sector Focus |
|---|---|---|
| S&P 500 | Blended (NYSE & NASDAQ) | Broad US Economy |
| Dow Jones Industrial | Blended (Mostly NYSE) | Blue-Chip Industry Leaders |
| NASDAQ Composite | 100% NASDAQ Listed | Tech, Biotech, Growth |
The exchange also matters when comparing indices. The Dow Jones Industrial Average and S&P 500 contain stocks from both exchanges, weighted by price and market cap, respectively. The NASDAQ Composite and NASDAQ-100 contain only NASDAQ-listed stocks—making them a direct measure of technology and growth stock performance.
3.8
Frequently Asked Questions
Can a stock move from NASDAQ to NYSE or vice versa?
Yes. Companies can transfer their listing between exchanges, though it requires meeting the new exchange’s listing standards and paying applicable fees. Tesla transferred from NASDAQ to — actually, Tesla remains on NASDAQ. Apple, Microsoft, and Intel have all remained on NASDAQ despite being large enough to list on the NYSE. The decision is often strategic and reputational rather than purely financial.
Is NASDAQ riskier to trade than the NYSE?
At the individual stock level, NASDAQ-listed technology and biotech stocks carry higher average volatility than NYSE-listed blue-chips. This means larger potential gains and larger potential losses per trade. The exchange itself does not create the risk — the types of companies listed there do. A mega-cap NASDAQ stock like Microsoft is no riskier to trade than a comparably sized NYSE stock.
Why do some stocks have four-letter tickers and others have three or fewer?
This is largely a historical convention. NYSE-listed stocks traditionally used one to three-letter tickers (GM, GE, F). NASDAQ-listed stocks traditionally use four or five letters (AAPL, MSFT, AMZN). There are exceptions on both exchanges, but this pattern holds for most major listings. ETFs often use three-letter tickers regardless of exchange.
Does after-hours trading work differently on the NYSE vs. the NASDAQ?
After-hours and pre-market trading on both exchanges operates through Electronic Communication Networks (ECNs) rather than through the regular auction or dealer mechanisms. Both exchanges see the same reduction in liquidity and increase in spreads outside regular hours. The exchange listing makes essentially no difference in extended-hours behavior.
3.9
quiz
Continue Your Learning
➜ Now you know where stocks trade — next, learn which instruments beginners should actually use: Stocks vs ETFs: Which Is Better for Beginner Traders?

